Advanced Remote Sensing
Displacement Map for Geohazard Assessment: Case Study of the 2021 Cumbre Vieja Volcanic Eruption
Co-author: A. Kiefer
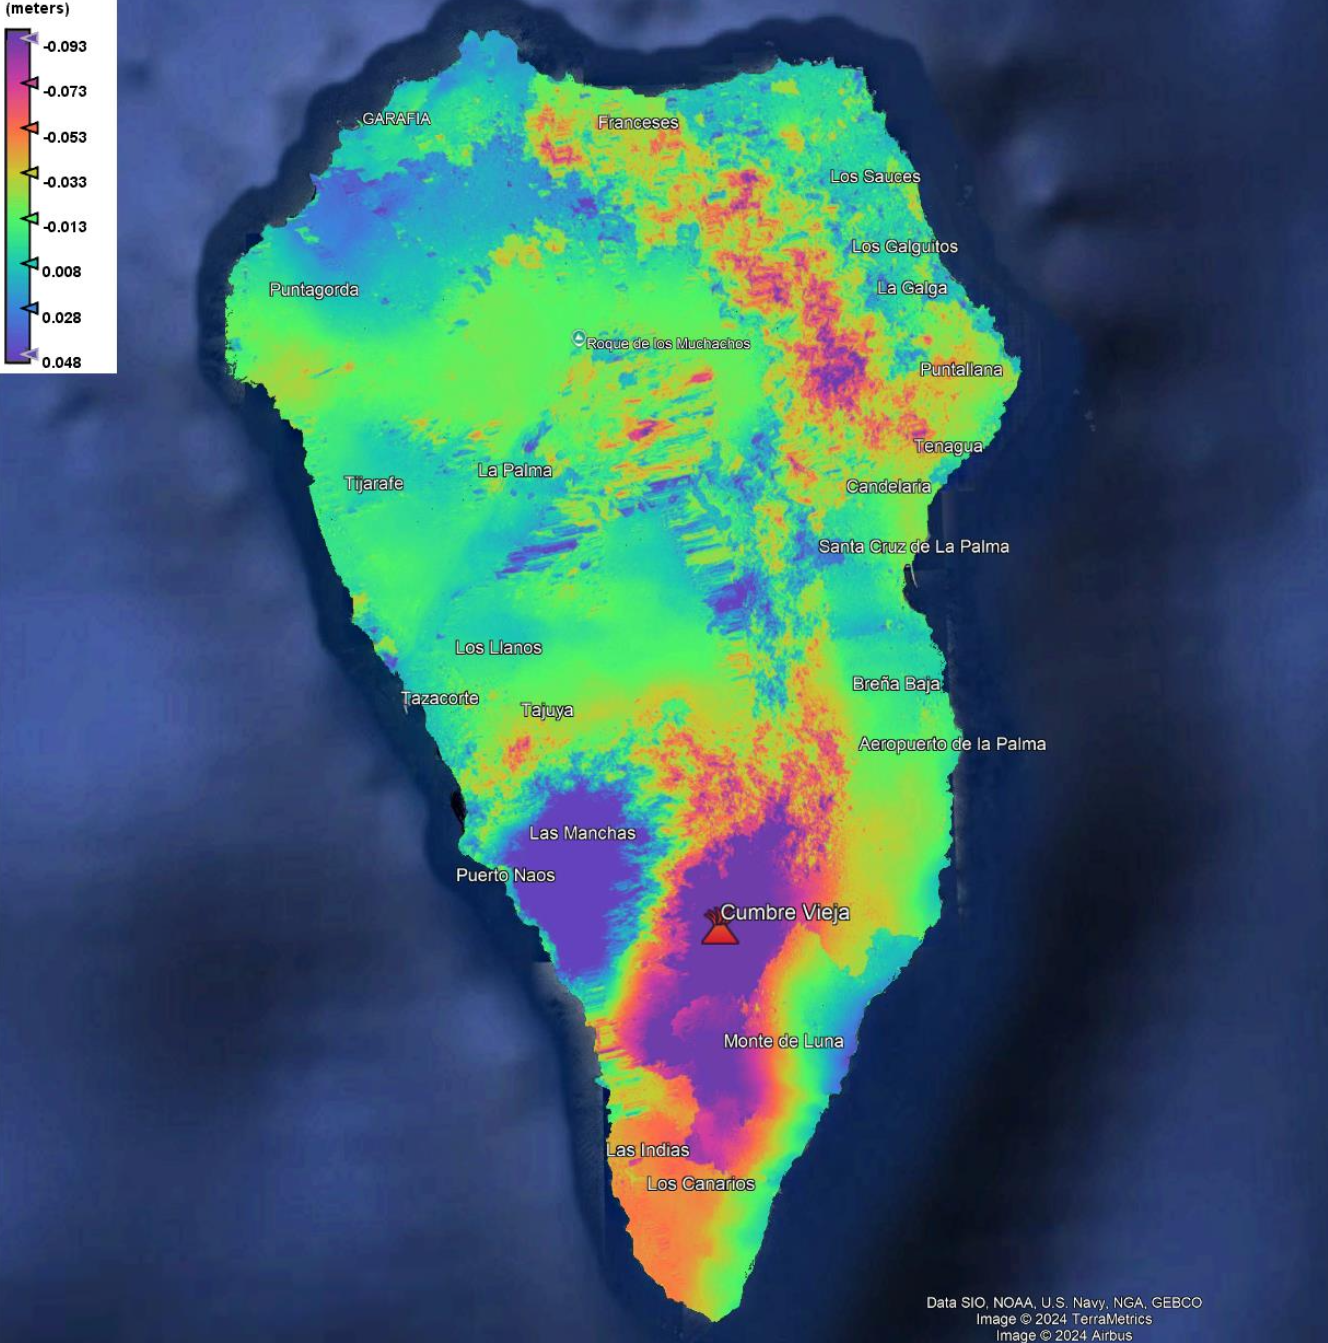
Using Sentinel-1 data and SNAP (Sentinel Application Platform from the European Space Agency), we created a displacement map to detect post-eruption deformations on La Palma (2021), to provide insights for geohazard assessment and monitoring. Here is the report: 🔗 Open report (PDF)
Analysis and Modeling (Remote Sensing)
This seminar was structured into four phases: Image acquisition, pre-processing, analysis, and delivery, emphasizing hands-on experiments and comparative methodological studies. My project focused on Pansharpening, where I implemented and compared four classical Component Substitution methods—Brovey, PCA, IHS, and Gram-Schmidt—using urban imagery from the PAirMAx dataset put forth by Vivone et al. (2021). I conducted quantitative and visual evaluations of the methods’ ability to enhance spatial detail while preserving spectral information. All algorithms were implemented in Python within a Jupyter Notebook. My seminar paper, titled A Comparative Analysis of Pansharpening Techniques for Very High Resolution Satellite Imagery can be found below.
Application Development (Earth Observation)
This course was aimed for students to gain a better understanding of Application Development focused on object-based image analysis (OBIA) using Cognition Network Language (CNL) in eCognition software. I chose to work with Python instead, creating an open-source alternative that maintains OBIA principles while making geospatial analysis more accessible.
Wildfire Burn Severity Classification using ResNet+FPN and Interactive OBIA
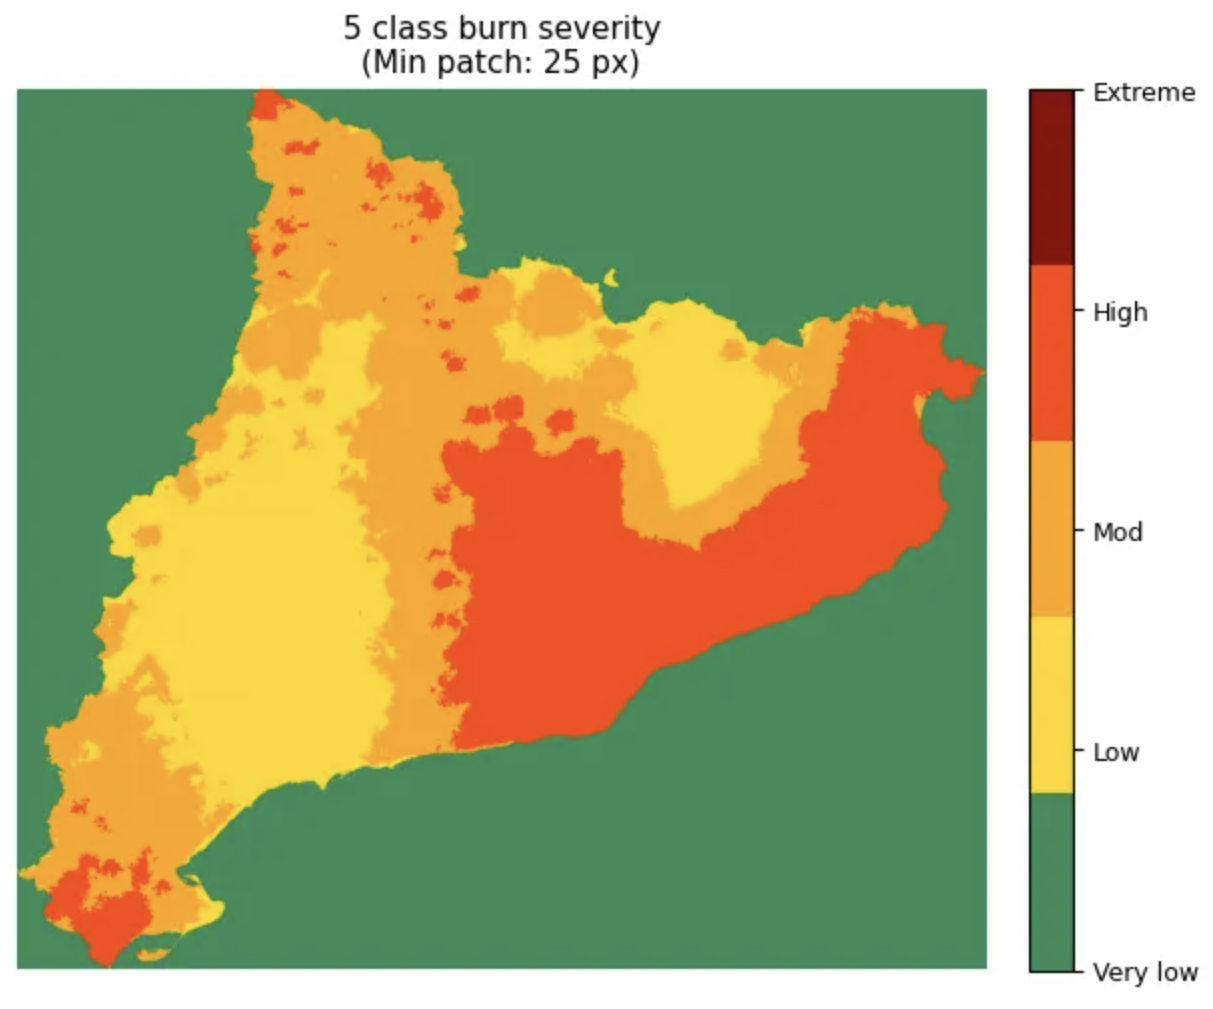
For my final project, I used CLIMAAX’s wildfire data for Catalonia (715 historical fires, 1991-2022) to develop burn severity maps. I combined ResNet and Feature Pyramid Network (FPN) deep learning enhancement with OBIA classification to create a 5-class severity system, achieving a 2.14x fire concentration index where high-risk areas (24% of landscape) captured 52% of historical fires. I built an interactive Gradio interface for real-time parameter exploration, mimicking eCognition’s GUI approach in an accessible web format.
Here is the link to the GitHub repository: 🔗 GitHub
Copernicus Hubs and Institutions
Digital Earth: Big Earth Data Concepts
Temporal Analysis in Google Earth Engine
In this project, I visualized the impact of the 2018 Camp Fire on Pulga, California. Using Sentinel-2 imagery from before and after the fire, my objective was to effectively highlight the extent of the damage, particularly the burn scars and vegetation loss.
Here’s a false-color visualization showing the area before and after the fire, showing the damage:
Geo-Humanitarian Action
In this course, the role of geospatial technologies in modern humanitarian action, from disaster response to conflict prevention, was examined. The topic I chose for my final presentation was Geo Data for Disaster Preparedness and here, you can see the ArcGIS StoryMap I used for my presentation:
Object-Based Image Analysis
This is my practical submission for the course:
Practice: Software Development
This course covered git versioning, collaborative GitHub workflows, and Python scripting for geospatial task automation using conda environments and object-oriented programming concepts.
Strava Dashboard
Co-authors: M. Fedyszyn, E. Gojdar, A. Moreno, N. Salazar-Cuellar
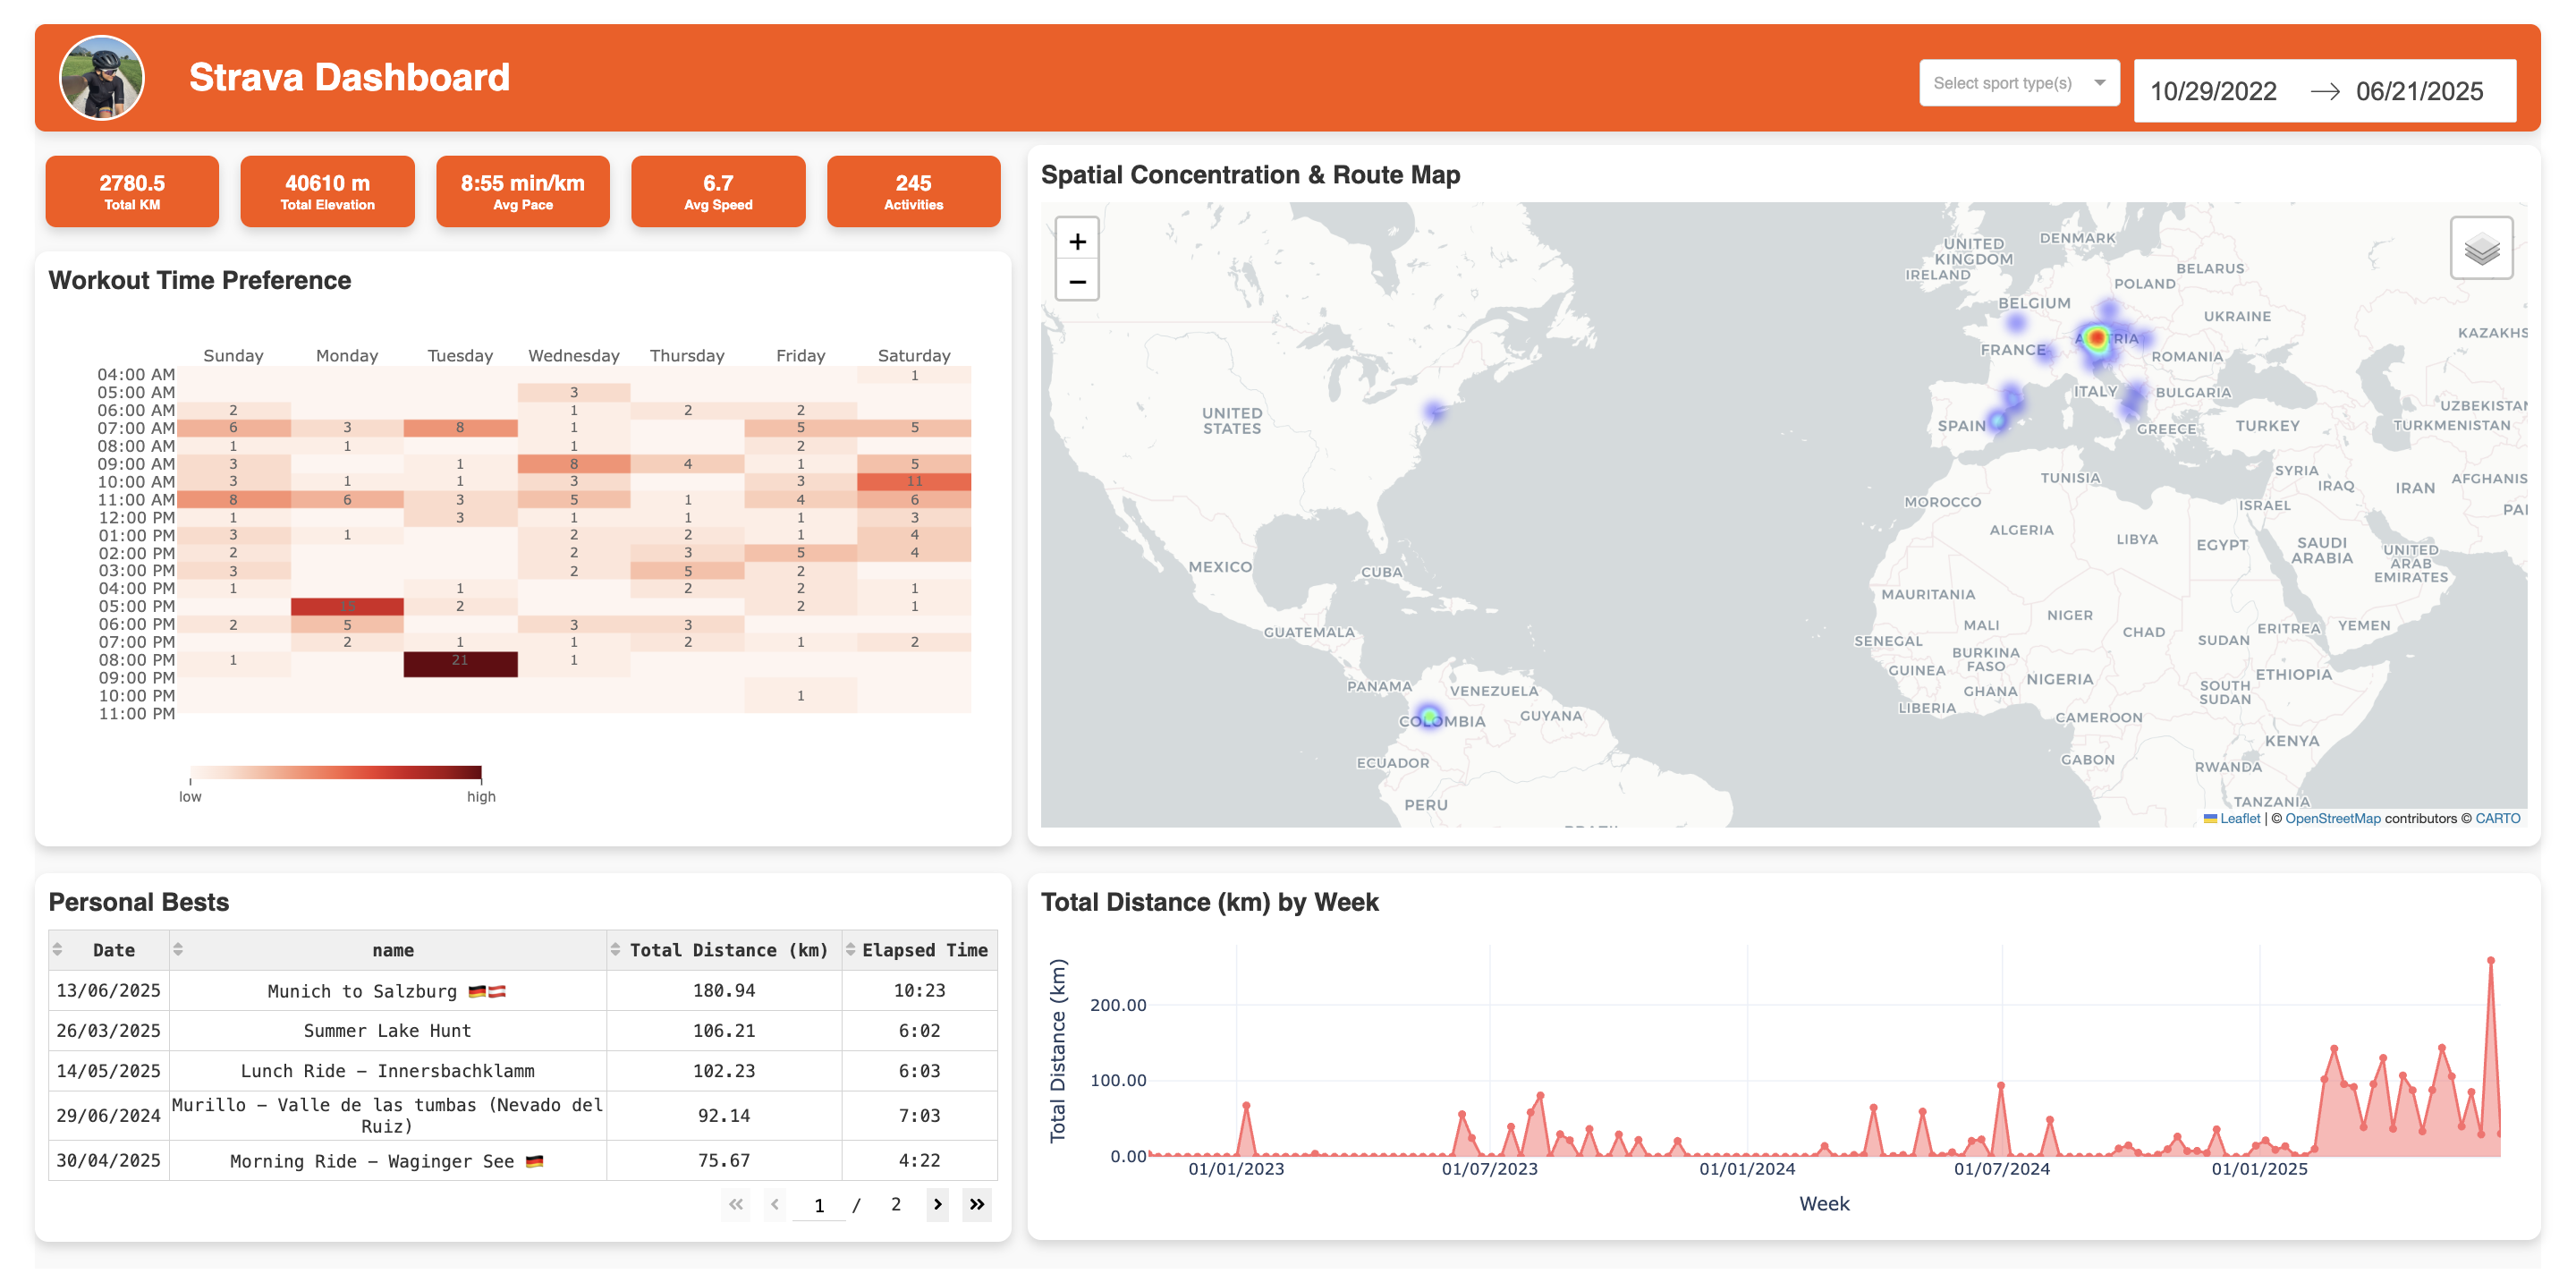
For the final project, my team and I built a Python Dash web-app dashboard that connects to the Strava API to visualize physical activity data. The browser-based tool analyzes workout trends, performance data, and activity distribution across locations. My contribution focused on spatial analytics, implementing hotspot analysis using Getis-Ord Gi* statistics to identify statistically significant clusters of activity intensity. I built heatmap visualizations that highlight exercise hotspots and patterns, showing how geospatial analysis can be used for fitness insights. Here is the link to our GitHub repository: 🔗 GitHub
Spatial Databases
For the final project, I designed a spatial database as the backend for a WebGIS application, using the Coachella Valley Music and Arts Festival as a case study. The database had entities such as stages, food areas, facilities, vendors, emergency exits, visitors, and artist lineups, with attributes and relationships mirroring real-world interactions. I generated realistic pseudodata (including spatial allocations) and populated the database with SQL scripts. The system supports user-specific queries—for example, finding nearby facilities or listing events by location—showing how spatial databases can improve festival management and visitor experience. My report can be found below.
Spatial Simulation
This course provided hands-on experience modeling spatial processes through agent-based simulation models and cellular automata using GAMA (GIS and Agent-Based Modeling Architecture), an open-source framework designed for spatially explicit simulation models.
Simulating Urban Growth and Land-Use Transitions in Lyon, France
Co-author: E. Lucas
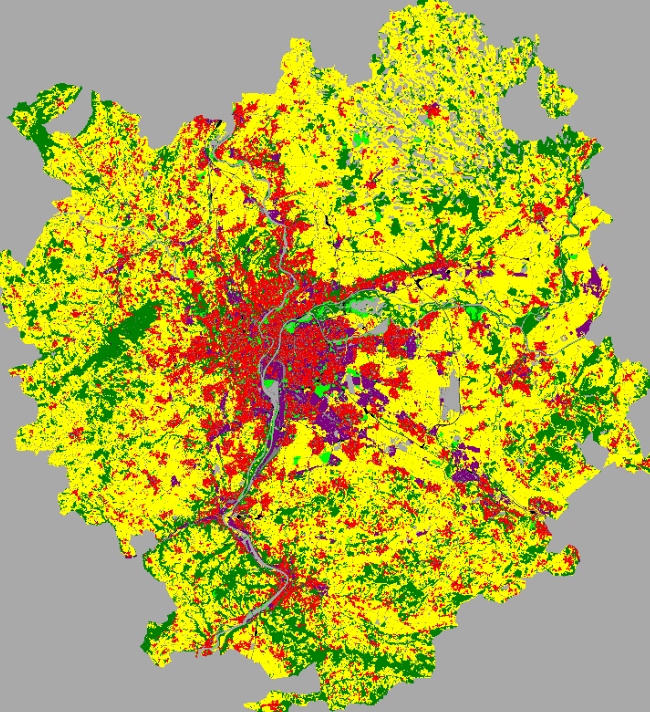
For the final project, my teammate and I developed a cellular automata model to simulate urban growth in Lyon, France, using 2012 Urban Atlas data as the baseline. We designed and implemented two policy scenarios: “balanced growth” (moderate expansion while preserving green areas) and “promote green areas” (strong incentives for urban green development). The model incorporated spatial factors including proximity to infrastructure, historical urban trends, and land-use transition probabilities. The simulation in GAMA ran through six annual cycles, tracking land-use transitions across five categories: agriculture, green spaces, urban areas, industrial zones, and natural areas. The model generated spatial prediction maps and quantified urban expansion sources, analyzing how different policy interventions influenced growth patterns. We validated the model outputs against actual 2018 Urban Atlas data to assess predictive accuracy and identify areas for model refinement.
Here is the link to our GitHub repository: 🔗 GitHub
Spatial Thinking and Modelling
In this course, spatial concepts, models, and GeoAI applications are explored to address geographic problems through lectures, hands-on exercises, and self-study.
A Spatial Simulation Approach to Model Grazing Dynamics on Vierkaser Pasture, Austria
Co-authors: B. Peres, M. Rigoto
This study applied spatial simulation to model grazing dynamics on the Vierkaser pasture, Untersberg, Austria, using geospatial data from drone imagery and manually digitized maps provided by Professor Gudrun Wallentin. The pasture was classified into distinct zones based on vegetation and soil characteristics, aiming to analyze cow movement influenced by managerial decisions and determine the maximum sustainable number of cows for ecological balance and profitability.
A grid-based simulation in the GAMA (GIS and Agent Based Modelling) software incorporated Agent-Based Modelling for cow behaviour and Cellular Automata for grass growth. The GAMA simulation analysed the balance between grazing and regrowth, and the results identified a sustainable number of cows.